ILEX Computing - Survey, Certification & Geodetic Solutions
Strategic Software for the Offshore Survey, Geophysical, Marine, Diving, Construction and Renewables Industries
LBL Planning tool for network coverage & redundancy
LBL Planner
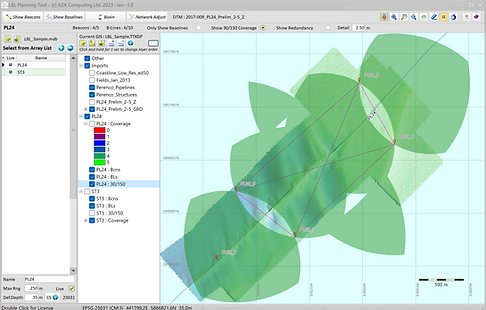
With "LBL Planner", users can import DTM/XYZ data for an area and drop acoustic beacons/transponders over the DTM to check coverage for your inspection/survey area.
The beacons can be moved to provide the best coverage by simply dragging with the mouse, updating the coverage chart.
Planning around imported infrastructure using the GIS background optimises planning.

Configuration
-
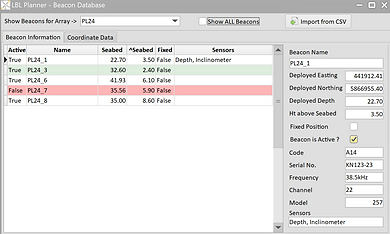
Beacons can be either dropped on the chart view or manually configured, baselines are directly computed.
-
Beacons can be enabled/disabled and impact on available baselines reflected on the screen interactively.
-
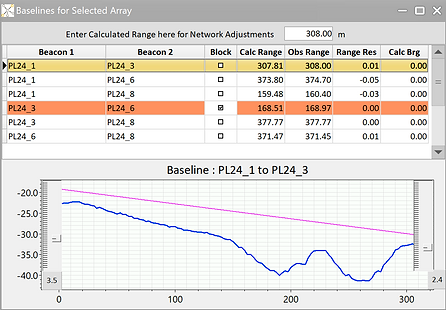
Based on the Beacon coordinates and the imported XYZ data each baseline can be shown with the direct path and the seabed itself.
-
beacon depths can be increased/decreased to remove and obstructions due to seabed topography.
-
As beacons are placed the array is displayed on the chart view, Angle of Cut and Coverage plots are automatically updated.
-
Boxin and Network adjustment are provided to optimise the array.
-
Entries provided for EPSG codes to set coordinate system, set a default depth (where XYZ data not applied) and max range to ensure realistic ranges are achievable.
30/150 angle of cut plots
A basic principle of multi-range positioning is the angle of cut to ensure redundancy and accuracy are maintained. This can be seen on the plot below.
As beacons are enabled/disabled the plot adjusts accordingly.

Coverage Plots
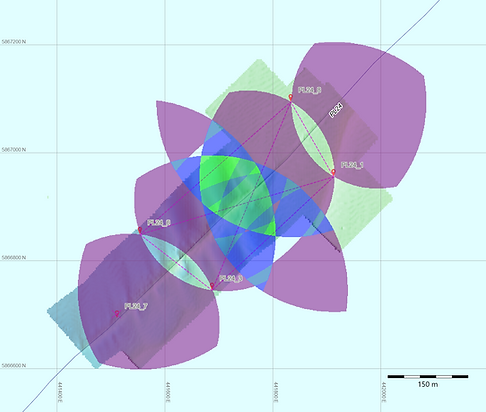
Coverage plots use the max range value and provides a coloured plot where the colours represent the number observations achievable in the operational area.
Calibrations
-
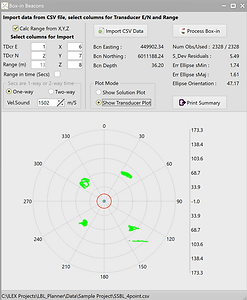
Box-in individual transponders
-
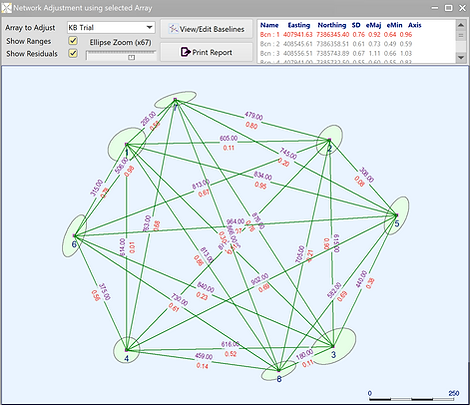
Network adjustment using least squares
-
Print calibration reports and summary of network.
-
Export results to CSV
